The Global
Bridging the gap between Data and Impact by connecting the dots of R&D related publications to answer WHO is doing WHAT with WHOM, WHERE, WHEN and HOW.
The Global Innovation Graph
Bridging the gap between Data and Impact by connecting the dots of R&D related publications to answer WHO is doing WHAT with WHOM, WHERE, WHEN and HOW.

MAPEGY DATA
Mapping data for your strategy
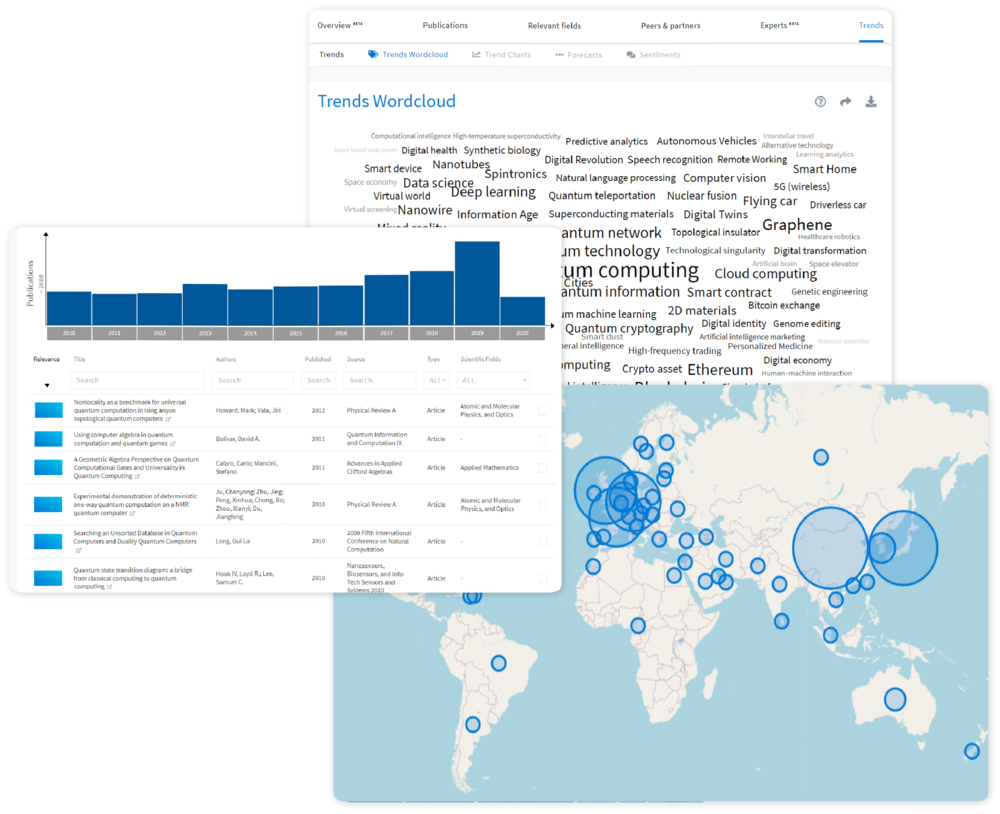
The Global Innovation Graph is a unique database that contains millions of worldwide publications (news, patents, websites, scientific publications, podcasts, projects, standards,…) organizations (companies, universities, startups, and investors) and experts (inventors, researchers, and managers).
For the last 10 years, we’ve not only stored these data in our Global Innovation Graph. We constantly analyze, structure and interpret all facts and figures, providing global innovators with easily understandable results, such as tables, and sophisticated visualizations.

Publications
Currently, we capture data from more than 150 patent offices, thousands of publishing houses, and public institutions, millions of websites, and news sources worldwide. Browse our sources and suggest more!
Players
Access companies, investors, startups, governmental institutions, hospitals, and more. Find below the top organizations and latest startups added to our Global Innovation Graph.
Trends & Forecasts
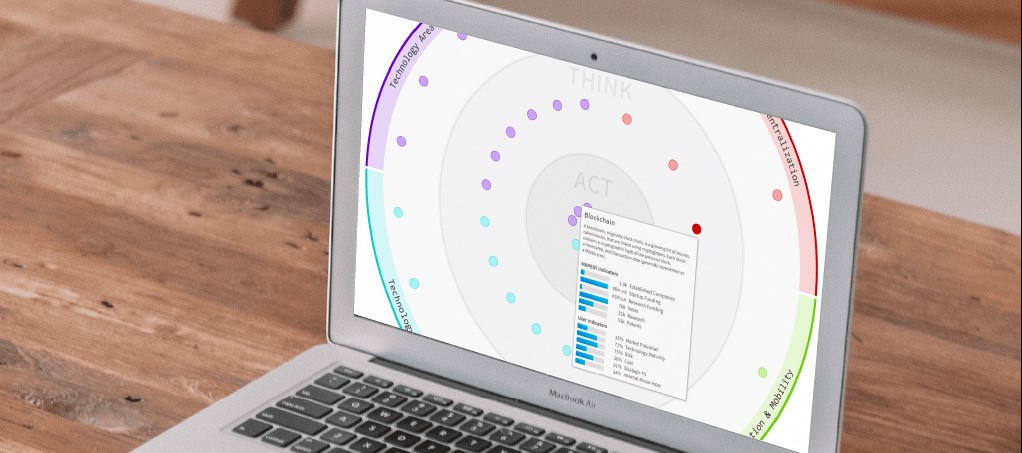
MAPEGY’s Global Innovation Graph helps you identify relevant trends, predictions, or emerging technologies.

Empower your innovation process
Access the latest trends, forecasts, startups, competitors, partners, technologies, and publications – from one source, fully automated and updated constantly.